
 November 2, 2026
 10 min read
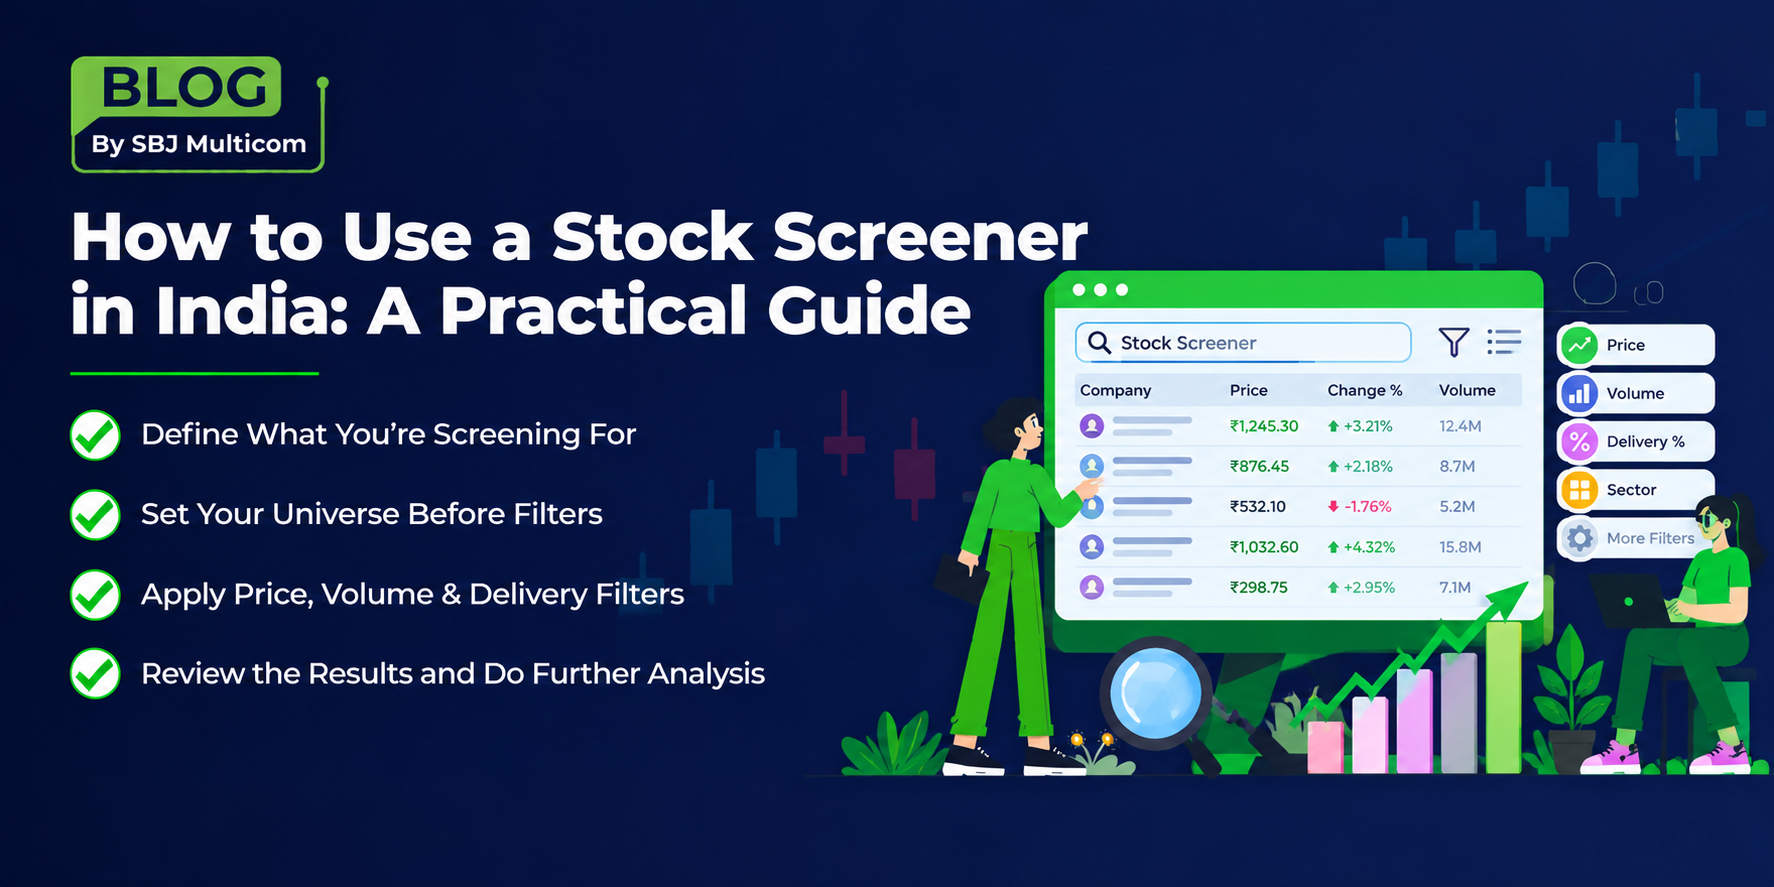
There are more than 2,000 companies listed and actively traded across the NSE and BSE. You cannot look at all of them.
Nobody can.
A stock screener solves that by doing one thing: you describe the conditions you care about, and it returns only the stocks currently meeting them. It does not tell you what to buy. It narrows two thousand names down to a dozen you can actually examine.
That distinction matters, and it is where most people misuse the tool. A screener is a filter you point, not an adviser you consult. Everything below is written on that basis.
What a screener actually does
Every listed company generates a continuous stream of numbers — price, volume, delivery quantity, open interest, and dozens of derived measures. A screener queries that data and returns the subset matching conditions you set.
Three things follow from this, and they are worth internalising before you build your first screen.
A screener reports the present, not the future. It tells you which stocks are up 3% today on twice their average volume. It has no view on whether they will be up tomorrow.
The output is a starting list, not a shortlist. A screen returning fifteen names has not identified fifteen candidates. It has identified fifteen stocks that share one characteristic, and the characteristic may be irrelevant to whether the business is worth owning.
You are responsible for the criteria. Change one number and the list changes completely. The screen reflects your assumptions, so it is only as sensible as they are.
Step 1: Decide what you are screening for
The most common mistake is opening a screener without a question. You end up adjusting filters until a list appears that looks appealing, which is not analysis.
Start by writing down what you want to find. For example:
Stocks trading near their day’s high on unusually heavy volume
Companies where a high proportion of buying is delivery rather than intraday
Futures contracts where open interest is building alongside a rising price
Stocks in a particular sector that have fallen more than 5% today
Each of those is answerable. “Good stocks to buy” is not.
Step 2: Choose your universe before your filters
Before setting any condition, define which stocks are eligible. Screening the entire market usually produces noise.
Narrow by:
Exchange segment — cash, futures and options, currency or commodity
Index membership — restricting to Nifty 50, Nifty 500 or a similar index removes very small and thinly traded companies
Sector or industry — if your question concerns banks, screen banks
Minimum turnover or volume — this is the single most useful guard. A stock that trades a few thousand rupees a day can show a dramatic percentage move that you could never actually trade.
Setting the universe first is what separates a usable screen from a list of illiquid names.
Step 3: Build a price screen
Price screens answer questions about where a stock is trading relative to a reference point.
Common conditions:
Percentage change from the previous close, above or below a threshold
Price relative to the day’s high or day’s low
Price near a 52-week high or 52-week low
Price crossing a moving average
A worked example. Suppose you want stocks showing strength today within the Nifty 500. You might set: index = Nifty 500; change from previous close greater than 2%; last traded price within 1% of the day’s high.
That returns stocks that are up meaningfully and holding near their highs rather than fading from them. It is a reasonable starting question. It is not a signal to buy anything, and you have not yet checked whether any of these companies is worth owning.
What to watch. A large percentage move on a stock that normally barely trades is a data artefact, not an opportunity. Your minimum turnover filter from Step 2 is what protects you.
Step 4: Build a volume screen
Volume is the number of shares traded. It matters because price movement without volume behind it tends to be weak — few participants are involved, and the move reverses easily.
Common conditions:
Today’s volume as a multiple of the average volume over the past 10 or 20 days
Absolute volume above a threshold
Volume ranked against the rest of the market
A worked example. Index = Nifty 500; today’s volume greater than twice the 20-day average; change from previous close greater than 1%.
This finds stocks moving on participation rather than on thin trading.
A caution. Volume spikes have mundane explanations. A single large block deal, an index rebalancing, or a stock entering the F&O ban period can all produce one. Always check whether news explains the volume before drawing any conclusion from it.
Step 5: Build a delivery percentage screen
This one is specific to Indian markets and is underused.
When shares are bought intraday and sold the same day, no delivery takes place — nothing moves into a demat account. Delivery percentage is the proportion of the day’s traded volume that actually resulted in shares being delivered.
A high delivery percentage means a larger share of buyers took the stock home rather than flipping it within the session. It is generally read as a sign of investment interest rather than speculative churn.
A worked example. Index = Nifty 500; delivery percentage above 60%; delivery quantity above its own 20-day average.
How to read it. High delivery is a fact about the day’s trading, not a prediction. Some stocks routinely show high delivery because they are illiquid and rarely traded intraday. Compare a stock’s delivery percentage against its own history, not against other stocks.
Step 6: Build an open interest screen (F&O)
If you trade futures and options, open interest is the measure worth screening on. It is also the one most often misread, so it is worth defining precisely.
Open interest is the number of contracts currently outstanding — positions opened and not yet closed. It is not volume. Volume counts trades during a session and resets to zero each day. Open interest carries forward until positions are closed or the contract expires. If a contract simply changes hands from one trader to another, volume rises and open interest does not move at all.
Open interest becomes informative when read alongside price. The standard interpretation:
PRICE
OPEN INTEREST
COMMONLY READ AS
Rising
Rising
Long buildup — new buying positions being created
Falling
Falling
Long unwinding — existing buyers closing out
Falling
Rising
Short buildup — new selling positions being created
Rising
Falling
Short covering — existing sellers closing out
A worked example. Segment = futures; change in open interest greater than 10%; price change greater than 1% — a long buildup screen.
Two cautions, and they matter. First, these interpretations are conventions, not laws; they describe what positioning is consistent with the data, not what will happen next. Second, unusually high open interest combined with a rapid price move indicates heavy leverage in that contract, which raises the risk of sharp reversals. Read it as a warning as readily as an opportunity.
If open interest is new to you, learn it before you screen on it. Screening on a measure you cannot interpret produces confident-looking lists you have no basis for acting on.
Step 7: Save your screens and let alerts do the watching
Rebuilding the same conditions every morning is how people stop using screeners.
Once a screen works, save it. Then set alerts so you are told when a stock you are tracking meets a condition, rather than checking manually through the session. The point of the tool is to remove the monitoring burden, not to add a daily chore.
Step 8: Treat the output as the beginning of the work
This is the step most often skipped, and it is the one that determines whether screening is useful to you.
A screener has told you a stock is up 3% on heavy volume with strong delivery. It has told you nothing about the business.
Before acting on any name from a screen:
Check whether news explains the move — results, an order win, a regulatory decision, a block deal
Look at the business itself: what it does, its revenue and profit trend, its debt, its cash flow
Check the shareholding pattern, particularly promoter holding and pledged shares
Consider whether it fits what you are actually trying to do
Our seven-step guide to researching a stock covers this in full. Screening finds candidates; research decides.
Common mistakes
MISTAKE
WHY IT COSTS YOU
Screening with no question
You tune filters until a pleasing list appears — that is not analysis
No liquidity filter
Large percentage moves on stocks you could never trade in size
Too many conditions
Over-filtering returns two names and hides everything useful
Too few conditions
Under-filtering returns 300 names, which is no better than the full market
Treating output as a buy list
The screen matched a condition; it did not assess a business
Screening on measures you cannot interpret
Open interest in particular — learn it first
Never revisiting saved screens
Conditions that suited one market phase stop working in another
Screeners and Market Pulse in Blaze
Blaze, the trading application from SBJ Multicom, includes both a screening tool and an alerting layer.
Screeners in Blaze cover price-based, volume-based and open-interest-based conditions. You can use the predefined categories or build custom screens by selecting exchange segment, sector and your own filter parameters — the criteria are set by you, and the tool returns the stocks currently matching them.
Market Pulse works alongside it, continuously scanning market activity and flagging technical developments such as movement around support and resistance levels and day high and day low breaks, so that conditions you are watching for surface without you monitoring charts manually.
Neither feature recommends securities. Both apply conditions you have chosen to live market data and report what currently matches. What you do with that list is your decision, and it should follow the research in Step 8.
Frequently asked questions
What is the difference between a screener and a scanner?
The terms are used interchangeably. Both apply conditions to market data and return matching stocks. Some platforms use “scanner” for continuously updating technical conditions and “screener” for filters you run on demand.
How many filters should one screen have?
Usually three to five. Fewer returns too much to review; more tends to over-fit until only a couple of names survive, which tells you little.
What is a good delivery percentage?
There is no universal figure. Compare a stock against its own recent history rather than against other stocks, since typical delivery varies widely by company.
Does open interest predict direction?
No. It shows how positioning is changing. Read alongside price it indicates what kind of positions are being opened or closed, not what happens next.
Can I screen for intraday and for long-term investing?
Yes, but not with the same screen. Intraday screens use price, volume and open interest. Investment screens use financial ratios, earnings growth and debt levels.
Should I act on screener results directly?
No. A screener produces candidates for research. Work through the business, the financials and the shareholding before any decision.
Try it yourself
Open an account with SBJ Multicom and build your own screens in Blaze.
[Open an Account] · [Explore Blaze] · [Read: How to Research a Stock Before Investing]