

 November 2, 2026
 8 min read
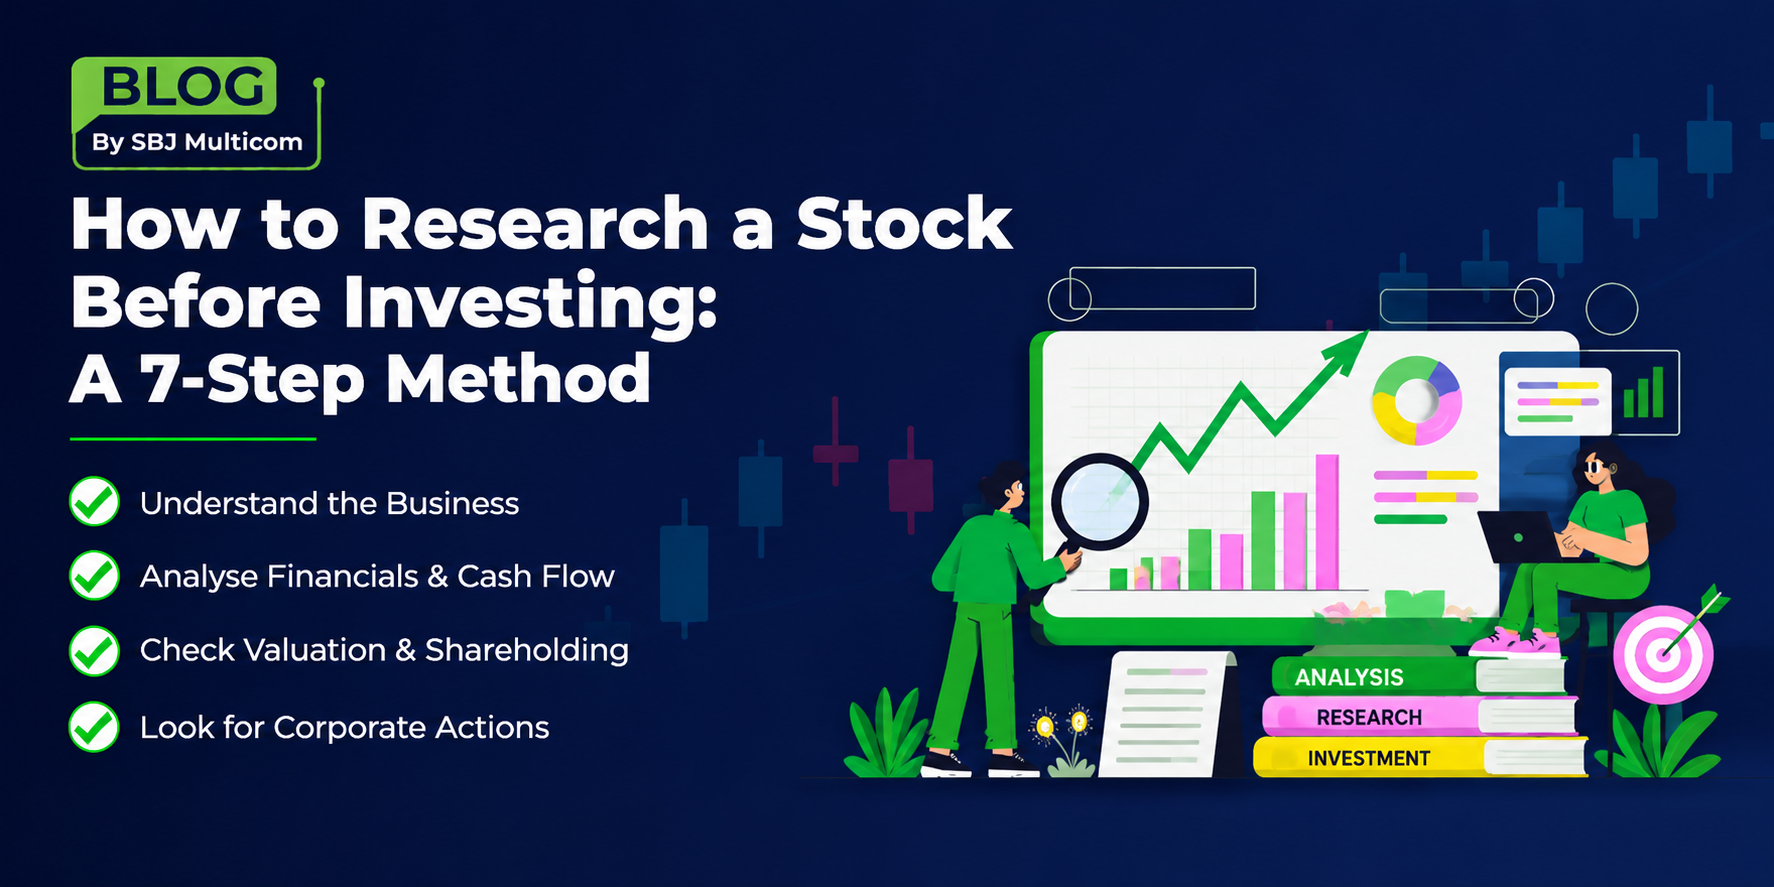
Most people buy their first stock because someone mentioned it. That is how nearly everyone starts, and it is also why many investors’ first few holdings may underperform.
Research does not require a finance degree. It requires a repeatable process that you apply to every company before you buy, so your decision is based on the business rather than a tip.
Below is a seven-step process, arranged in the order that can save you the most time — because if a company fails an early step, you may not need to spend time on the later ones.
Step 1: Understand What the Business Actually Does
Before looking at a single number, answer one question in plain language:
How does this company make money?
If you cannot explain it in two sentences to someone who does not follow the markets, you may not yet understand the business well enough to own it.
Look for:
The core products or services and which of them generates most of the revenue
The sector and industry in which the company operates
Who its customers are — a few large clients or millions of small ones
Who its competitors are
Whether the business is cyclical and where that cycle currently sits
Red flag: A company whose business direction has changed several times within a few years. Frequent reinvention can indicate that the previous business model did not work.
Step 2: Read the Income Statement for the Trend, Not Just the Number
A single year tells you very little. Five years can tell you a story.
Look at:
Revenue — Is it growing, flat or shrinking over five years?
Operating profit — Is it growing at least as fast as revenue? If revenue rises while operating profit does not, the company may be paying heavily for that growth.
Net profit — Is the profit supported by operations, or by one-off items such as an asset sale?
Margins — Are they stable, improving or under pressure?
Red flag: Revenue rising steadily while profit remains flat. This can indicate that costs are rising as fast as sales, or that the company is discounting to maintain market share.
Step 3: Check the Balance Sheet for How Much Is Borrowed
The income statement shows performance. The balance sheet shows financial strength and survivability.
Look at:
Total debt — Is it rising or falling year on year?
Debt-to-equity ratio — How much has been borrowed compared with the amount owners have invested? What counts as high varies significantly by industry. A bank or infrastructure company will typically carry far more debt than a software company.
Cash and cash equivalents — Can the company comfortably meet its obligations?
Current ratio — Do short-term assets cover short-term liabilities?
Red flag: Debt rising faster than revenue over several years. This may indicate that the company is borrowing to sustain operations rather than to fund growth.
Step 4: Confirm the Profit Is Real by Reading the Cash Flow Statement
This step is often skipped, yet it is one of the most useful for identifying potential problems.
Accounting profit and cash are not the same thing. A company can record a sale as revenue before the customer has actually paid. Cash flow shows what actually came into the business.
Look at:
Cash flow from operations — This should be positive and broadly track net profit over time
Cash flow from investing — Is the company investing in its own capacity?
Cash flow from financing — Is the company repaying debt or continually raising more?
Red flag: Consistently reported profit alongside consistently negative operating cash flow. This may indicate that reported profit is not translating into actual cash.
Step 5: Use Ratios to Compare, Not to Decide
Ratios are useful for putting two companies side by side. In isolation, they can be difficult to interpret, and they are generally most useful when comparing companies within the same industry.
The ratios worth knowing:
P/E (Price to Earnings) — The price paid per rupee of earnings. A high P/E can mean a stock is expensive, or it can mean the market expects future growth.
P/B (Price to Book) — Price compared with the accounting value of assets. This can be more meaningful for banks and asset-heavy businesses.
ROE (Return on Equity) — What the company earns on shareholders’ money. Useful, but check whether a high ROE is being driven by heavy borrowing.
ROCE (Return on Capital Employed) — Return on all capital, including debt. It can provide a broader view of how efficiently the company uses capital.
Debt-to-Equity — A measure of borrowing relative to shareholders’ equity.
Dividend yield — Dividend relative to the share price, relevant if you are investing for income.
Red flag: Using a single ratio as the basis for a decision. A low P/E can mean a stock is cheap, or it can mean the market has good reason to doubt future earnings.
Step 6: Look at Who Owns the Company
The shareholding pattern tells you something the financial statements cannot: who has money at stake and whether that ownership is changing.
Look at:
Promoter holding — The founders and controlling group. A stable or rising promoter stake can indicate confidence.
Pledged promoter shares — This is important. When promoters borrow against their own shareholding, a falling share price can trigger lenders to sell the pledged shares, potentially pushing the price down further. High pledging is a genuine risk factor and is disclosed quarterly.
FII holding — Foreign institutional investors
DII holding — Domestic institutions, including mutual funds and insurers
Public shareholding — Retail and other smaller holders
Red flag: Falling promoter holding combined with rising pledged shares. Read that combination carefully before going further.
Step 7: Check Recent Corporate Actions and Announcements
Corporate actions can change the mechanics of what you own and can also explain price movements that may otherwise appear alarming.
Look for:
Dividends — Declared amount and record date
Bonus issues — Additional shares issued to existing holders
Stock splits — Face value is divided; the share price falls proportionately, while the overall value of your holding does not change because of the split itself
Rights issues — Existing holders are offered new shares, often at a discount
Buybacks — The company purchases its own shares
Red flag: Repeated rights issues over a short period. This may indicate that the company is relying on shareholders for working capital.
Putting It Together
STEP
WHAT YOU ARE CHECKING
MAIN RED FLAG
1
The business model
Direction changes repeatedly
2
Income statement trend
Revenue grows, profit does not
3
Balance sheet strength
Debt grows faster than revenue
4
Cash flow quality
Profit reported, cash not received
5
Ratios vs peers
Any single ratio used alone
6
Shareholding pattern
Promoter stake falling, pledging rising
7
Corporate actions
Repeated rights issues
Work through these steps in order. Many companies that disappoint investors reveal warning signs at Step 3 or Step 4, potentially saving you the time of going through the rest of the analysis.
Doing This Without Twelve Browser Tabs
The biggest obstacle for many investors is not understanding the method. It is finding all the information.
The relevant data may be spread across annual reports, exchange filings and several financial websites. By the time you have gathered everything, the initial motivation to research can disappear.
Blaze from SBJ Multicom brings these data points into the application you already use to trade:
Company Information — Profile, business overview, sector and industry, for Step 1
Financial Statements — Income statement, balance sheet and cash flow statement, for Steps 2, 3 and 4
Financial Ratios — For Step 5
Shareholding Pattern — Promoter, FII, DII, mutual fund and public holdings, for Step 6
Corporate Actions — Dividends, bonuses, splits and rights issues, for Step 7
Key Stats — Headline metrics on a single screen
Health Score — A summary indicator derived from available company data
A Word on the Health Score
The Health Score — like any summary score of this kind — is a condensed view of underlying data, not a recommendation.
Treat it as a prompt to look more closely at a company, never as a substitute for the seven steps above.
Frequently Asked Questions
How long should researching one stock take?
Around thirty to forty-five minutes once you are familiar with the sequence. Companies that fail Step 3 or Step 4 may require considerably less time.
Where does this data originally come from?
Listed companies file their results and shareholding patterns with the stock exchanges every quarter. Platforms present this filed data; the underlying source is the company’s own disclosure.
What is promoter pledging and why does it matter?
Promoters sometimes borrow money using their shares as collateral. If the share price falls far enough, the lender can sell those shares, which can push the price down further. Promoter pledging is disclosed each quarter and is worth checking every time.
Is a low P/E ratio a buying signal?
Not on its own. A low P/E can indicate an undervalued company, or it can indicate that the market expects earnings to decline in the future.
Read the P/E alongside the trend in earnings and the company’s level of debt.
Should I research before every purchase, or just the first time?
Before every purchase, and periodically for stocks you already hold. Shareholding patterns and debt levels can change from quarter to quarter.
Does this replace professional advice?
No. This is a framework for understanding a company. For advice specific to your circumstances, consult a SEBI-registered investment adviser.
Start Researching
Open an account with SBJ Multicom and use Blaze to work through these steps on any listed company.
[Open an Account] · [Explore Blaze] · [Talk to Our Team]